Global E-Commerce: Do Your Sales Numbers Tell the Same Story? — Report Design in the Age of Agentic BI
Introduction
Hello, I’m Mia Sato, AI Researcher at GDX.
When supporting global EC projects at GDX, we sometimes hear requests such as, “We want to automate report creation more.”
But when looking at the actual workplace, the issue is not only that reports take time to create. Every meeting adds another request for “one more number,” and as sales channels increase, the number of data sources and formats also grows.
In some cases, the person creating the report is simply updating it as a routine, without fully understanding what each number is used to decide. On top of that, Excel adjustments and manual correction rules can accumulate differently depending on the person in charge.
While looking at this situation, I researched recent developments in Agentic Business Intelligence, also known as Agentic BI. What interested me most was actually the step before using AI or BI.
Before asking AI or BI to look at numbers, are we clear about where those numbers come from, what they are used for, and where they eventually connect?
In this article, I will use the recent movement around Agentic BI as a starting point to think about the “flow of numbers” that global EC teams should design before launch.
Will BI solve the problem just because reporting is difficult?
BI, or Business Intelligence, is a system for collecting company data and analyzing or visualizing information such as sales and inventory.
When report creation becomes difficult, it is tempting to think, “If we put all the raw data into BI, things will become easier.”
But changing the tool alone does not always solve the problem.
For example, even the word “sales” can mean different things. It may refer to the amount at the time of order, the amount at the time of shipment, or the amount after returns and discounts have been reflected.
If reports are automated in that state, ambiguous definitions are automated as well.
What matters first is to clarify:
Who is looking at this number, and what decision are they making with it?
The flow of numbers to design before launch
In global EC, an order placed on an EC site does not automatically become the company’s sales number or accounting figure as-is.
At a high level, the flow looks like this:
Order → Shipment → Sales Recognition → Payment → Deposit → Accounting
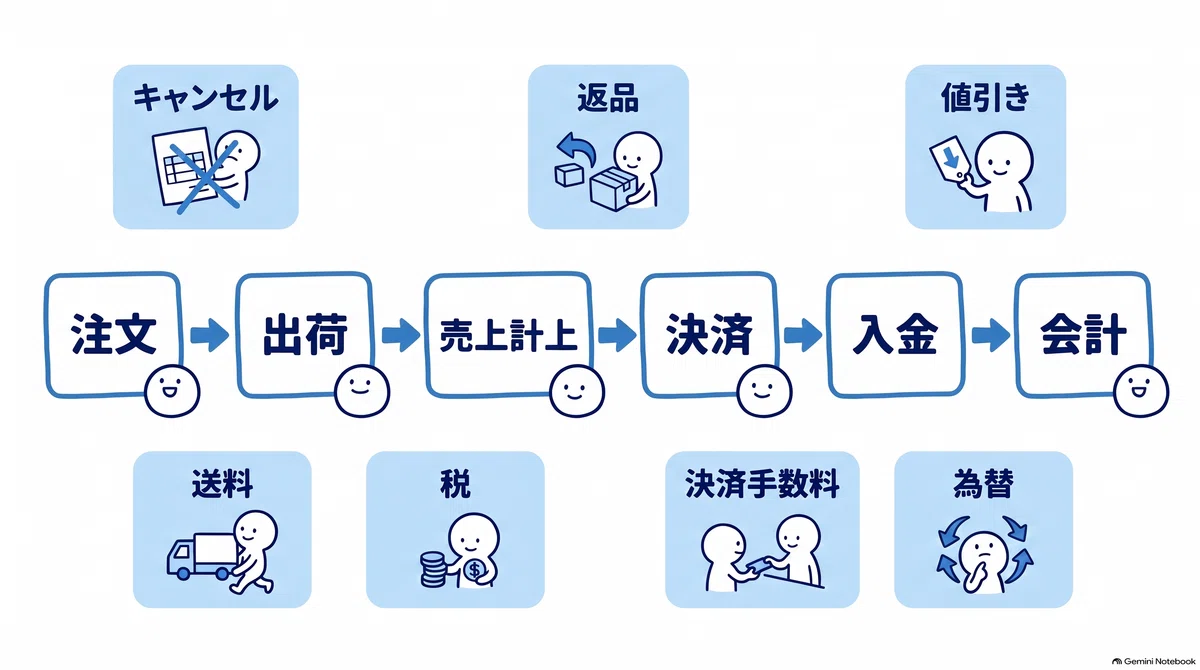
An image showing how numbers connect from order to accounting in global EC.
Along the way, cancellations, returns, discounts, shipping fees, taxes, payment fees, and foreign exchange can all affect the numbers.
For example, even if a 100-dollar order appears on the EC site, a later return, taxes, payment fees, or currency conversion can mean that the order amount on the EC site, the actual deposit amount, and the sales or expense figures used in accounting are not all the same.
If the team has not defined which point in the process should be called “sales,” people will have to investigate the reason every time the EC report and accounting data do not match.
Before launch, I think at least the following points should be organized.
- Which KPI is used for which decision
- How terms such as sales, returns, and inventory are defined
- Which system or data source is treated as the source of truth
- Which keys connect the data, such as Order ID or SKU
- How EC numbers connect to accounting data
- When the numbers should be reconciled
The important point is not to build a perfect BI system from the beginning.
It is okay to start manually
At launch, the report may still be in Excel, and the process may still be manual.
However:
Starting manually is different from starting without deciding how the work can later be automated.
If operations begin without defining numbers and data sources, correction rules may start increasing by person or channel, such as subtracting returns later only for one channel or using a different exchange rate only for one data source.
Then, when the team tries to automate later, the first task becomes deciphering what each number originally meant.
It is not necessary to automate everything from the beginning. But designing where the numbers come from and where they connect becomes the foundation for later connecting the work to BI or AI.
That is where Agentic BI becomes useful
Once this foundation for numbers is organized, the value of recently emerging Agentic BI also becomes easier to see.
With Looker Agentic Workflows, announced by Google in July 2026, users can specify conditions in natural language, continuously monitor metrics, and analyze factors that influenced changes.
Qlik also offers Discovery Agent, strengthening the direction of finding anomalies and new trends by comparing current data with past data patterns.
Looking at these features, I feel that BI is expanding from something where people open dashboards and search for numbers, into something where AI continuously watches data and alerts people to the changes they should check.
But for that to work, the meaning of the numbers AI is watching must be organized.
What is called sales? Which data is the source of truth? Which changes are important?
If that foundation exists, it becomes easier to create a flow like this:
Design the flow of numbers → Organize definitions and data sources → AI continuously monitors the data → AI alerts only changes and anomalies → People connect them to decisions and actions
What to design before BI
Researching Agentic BI reminded me again that the important part is not only the AI itself, but the number design that comes before it.
In global EC, as the number of countries and sales channels increases, the systems and data that numbers pass through from order to accounting also increase.
That is why what teams need before introducing BI or Agentic BI is not simply a clean dashboard.
What matters is designing where numbers come from, what they mean, and how they connect from decision-making to accounting.
With that foundation, even if the first version is manual, it becomes easier to connect the work to BI or AI later.
And as Agentic BI evolves further, we may move closer to a workflow where people no longer keep collecting numbers and creating reports by hand. Instead, AI continuously monitors the data, and only the changes that require action arrive in the workflow.
Before introducing AI, we need to create a “flow of numbers” that AI can correctly understand.
When thinking about launching global EC, I feel this perspective will become increasingly important.
References
- Official: Automate data monitoring and root-cause analysis with Looker Agentic Workflows / Google Cloud / Google Cloud
- Official: Use agentic workflows to monitor changes in your data / Google Cloud Documentation / Google Cloud Documentation
- Official: Introducing the Discovery Agent, now available! / Qlik / Qlik
- Official: Introducing the Next Evolution of Agentic Analytics in Qlik / Qlik / Qlik
※ Part of this article was created with the support of AI and edited by the author. The content reflects the author’s personal views and does not represent the official views or statements of GDX Inc. The information is provided for reference purposes only. Please refer to each company’s official announcements and primary sources for the latest details.
#AI #AgenticBI #BI #DataAnalytics #GlobalEC #EC #GenerativeAI #DX