Will Claude’s Evolution Become an Ally for E-Commerce Operations? Three Updates to Watch for in 2026

Introduction
I’m Mia Sato, AI Researcher at GDX.
I have been following Claude’s recent updates, and honestly, I am quite excited about where it is heading.
Until recently, Claude had a strong reputation as a tool that was good at reading long documents and writing natural, polished text.
That is still one of its major strengths.
But when I look at the latest Claude updates, I feel that it is no longer limited to just writing and summarizing text.
It can look at Excel files, create files, and turn numbers into charts.
In other words, Claude is getting much closer to everyday business operations.
That is the part I found most interesting this time.
In e-commerce operations, teams look at spreadsheets almost every day.
Sales, inventory, SKUs, ad spend, ROAS, return rates, and category performance.
The data exists.
But it is often spread across different places, and it takes time to prepare it for meetings or reports.
“The data is there, but it is not yet in a form that people can discuss right away.”
I think this happens quite often in real operations.
And this small friction can be surprisingly heavy.
So in this article, I will look at three recent Claude updates that may help with spreadsheet and reporting work in e-commerce operations.
- Claude for Excel
- Create / edit files
- Interactive charts / visualizations
Looking at Claude’s Three Updates from an E-Commerce Operations Perspective
From here, I will translate Claude’s updates into practical e-commerce operations scenarios.
After trying them with e-commerce workflows in mind, I felt that the key points were quite simple.
- It becomes easier to read and analyze existing Excel files
- It becomes easier to turn CSVs and raw data into shareable files
- It becomes easier to turn numbers into charts or dashboard-like visuals
In other words, Claude seems to be moving from an AI that returns text to an AI that can help create the spreadsheets and documents used in daily operations.
This is where things start to get really interesting.
1. Claude for Excel: Easier Analysis of Sales, SKUs, and Inventory Inside Existing Excel Files
The update that felt closest to e-commerce operations for me was Claude for Excel.
The important point here is that Claude for Excel is used to look inside an existing Excel file and help with analysis or checks.
In e-commerce operations, teams spend a lot of time looking at Excel files.
- Sales data
- Units sold by SKU
- Inventory levels
These pieces of information are often spread across multiple sheets.
And simply looking at the numbers is not enough.
- Which SKUs may run out of stock soon?
- Which products are selling well but have low inventory?
- Are any formulas misaligned?
- Can conditional formatting help identify outliers?
Only after checking these points can the team move on to the next decision.
With Claude for Excel, it becomes easier to work while looking at the data in Excel, including analysis, formula checks, pivot tables, charts, and conditional formatting.
If I were to test this in e-commerce operations, I would start with an Excel file for SKU-level sales analysis.
For example, an Excel file that includes product category, SKU, inventory, units sold, sales, ad spend, ROAS, and returns.
I would ask Claude questions such as the following.
- Which products are selling well but have low inventory?
- Which products are using ad spend but not generating enough sales?
- Which products have many returns?
- Which formulas or aggregations should be checked?
Even this simple use case makes the value quite clear.
What I find especially helpful is that Claude can suggest where to look next while reading the numbers.
Someone who is very good at Excel may be able to find those points on their own.
But when teams are busy with weekly operations, having Claude surface the first points to check can be a big help.
2. Create / Edit Files: Turning CSVs and Raw Data into Shareable Files
The second update is Create / edit files.
This plays a slightly different role from Claude for Excel.
If Claude for Excel is about analyzing an existing Excel file, Create / edit files is about creating a new file from source data.
For example, there may be a CSV file, a simple table, or data that is not yet organized.
The idea is to turn that data into something easier to share, such as an Excel report, PDF, PowerPoint document, or template.
In e-commerce operations, teams often work with CSV files.
However, a raw CSV is not always easy to share as-is.
- The column names may be hard to understand
- The necessary information may be split across different files
- The data may not be suitable for showing directly in a meeting
These situations are quite common.
With Create / edit files, it becomes easier to turn CSVs and raw data into Excel templates or report formats.
It may also be useful not only for report creation, but also for data integration.
For example, when importing products, several files such as POs, purchasing summary sheets, and appeal point documents may arrive at different times.
In some cases, these files do not share a common product identifier. Even when they refer to the same product, the notation may differ slightly, such as full-width or half-width characters, uppercase or lowercase letters, spaces, or hyphens.
When that happens, manually matching and combining the files into one master file becomes quite difficult.
In this kind of situation, Claude can be seen not as an AI for analysis, but as an AI that helps align and integrate scattered data.
It can help normalize inconsistent notation, match multiple files, and bring the data closer to a single master file.
Of course, the final check should still be done by a person.
But even if Claude only supports the preparation stage before final confirmation, that can still be very helpful.
Before analyzing numbers, the data first needs to be made usable.
This is another small but important point in e-commerce operations.
3. Interactive Charts / Visualizations: Making KPIs and Sales Trends Easier to Understand
The third update is Interactive charts / visualizations.
I also think this has strong potential for e-commerce operations.
In e-commerce work, there are many situations where reading numbers as text is not enough.
- Are sales increasing?
- Which categories are growing?
- Which products suddenly dropped?
For these questions, charts are often faster than tables.
If Claude can create interactive charts and visualizations, checking KPIs becomes much easier.
For example, teams can review the following.
- Monthly sales trends
- Sales by category
- Inventory risk by SKU
Turning these into charts can shorten the time needed for pre-meeting alignment.
Testing with Dummy Data
So far, I have looked at Claude for Excel, Create / edit files, and Interactive charts / visualizations separately.
But in real operations, it is easier to understand their value when they are tested together rather than separately.
So this time, I created a simple test based on a weekly report for e-commerce operations using dummy data.
The CSV included product category, SKU, month, sales, units sold, inventory, ad spend, ROAS, and returns.
No real customer information or actual sales data was used.
1. First, I asked Claude to create an Excel report for the e-commerce operations team based on the CSV.
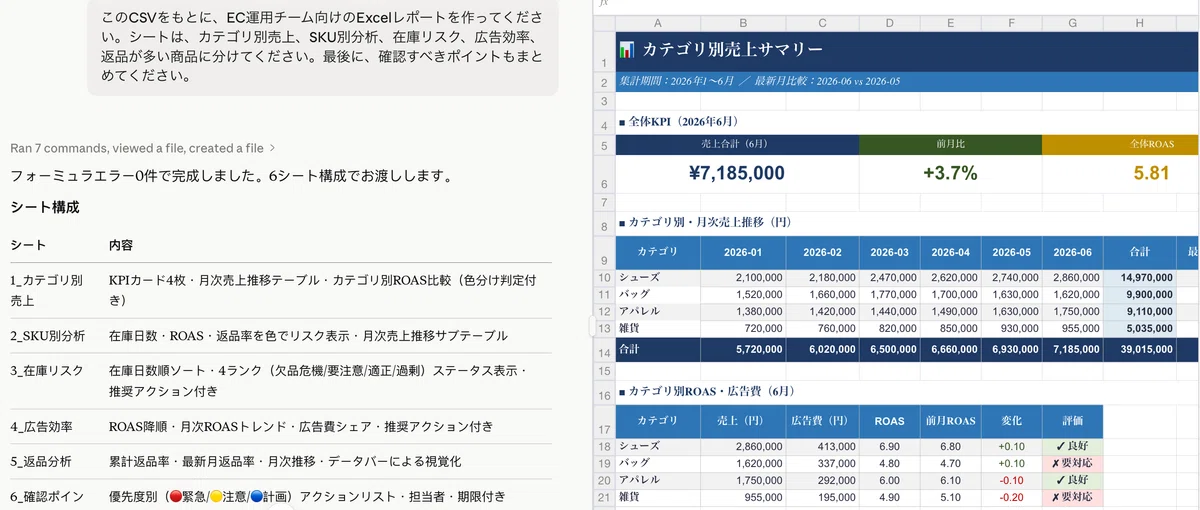
This is where Create / edit files comes in.
If the data remains as a CSV, the team needs to manually check columns and aggregate the numbers.
But by asking Claude, the data can be organized into a report that is easier to review, including sales by category, SKU analysis, inventory risk, ad efficiency, and products with many returns.
2. Next, I asked Claude for Excel to analyze the Excel report.
Here, the goal is not to create a new file.
Instead, the idea is to look inside the existing Excel file and identify which points should be checked.
For example, SKUs that are selling well but have low inventory, or formulas and aggregations that may need to be reviewed.
I asked Claude to surface these points.
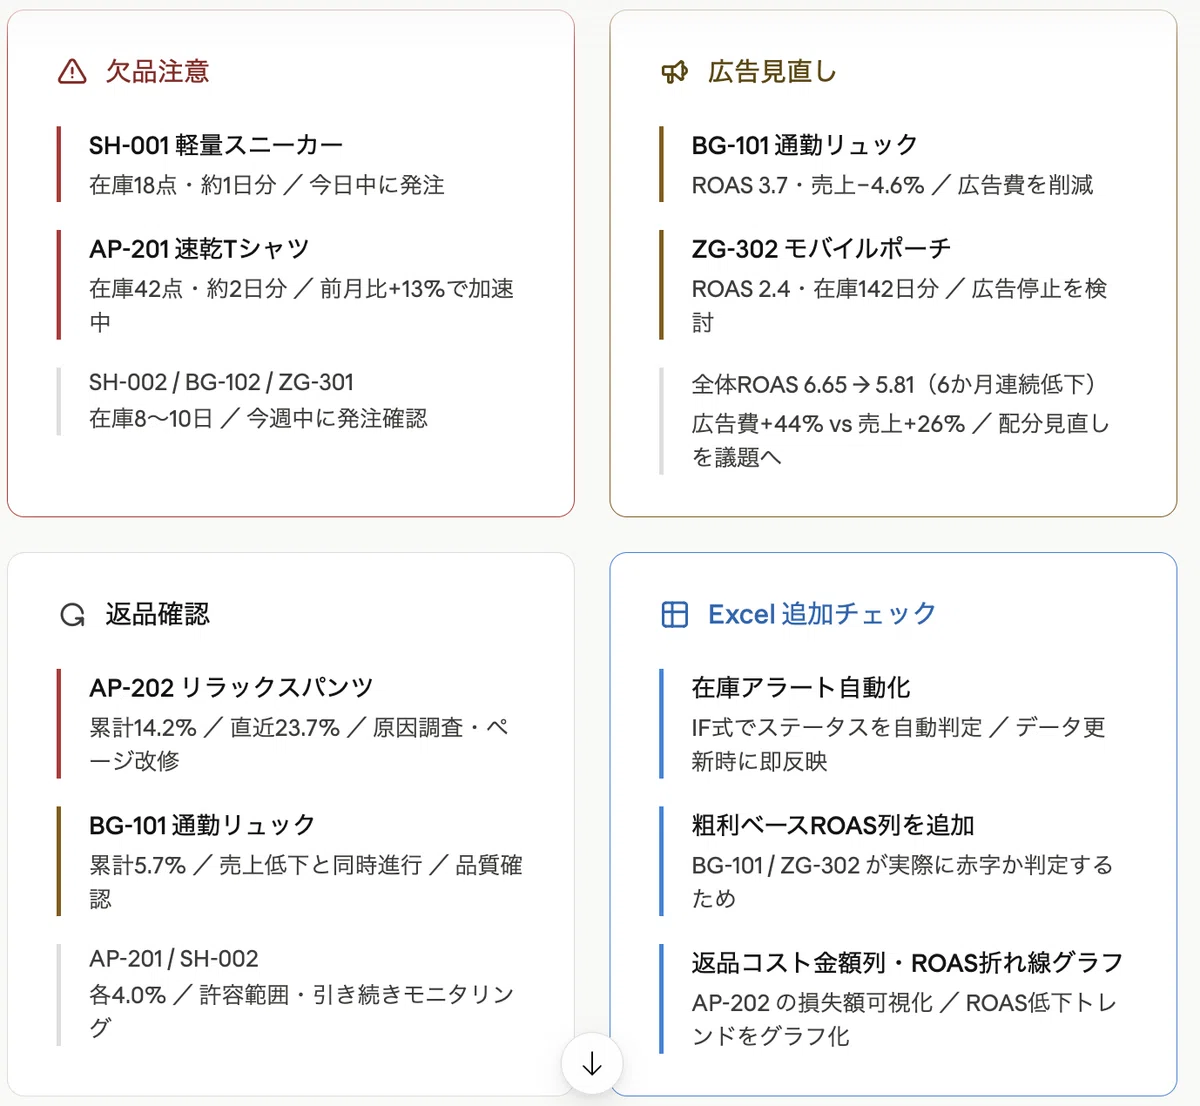
3. Finally, I used Interactive charts / visualizations to create charts for monthly sales trends and sales by category.
At this point, the workflow starts to feel close to actual meeting preparation.
- Instead of reading the entire table, first look at the overall trend through charts
- Then check SKUs with inventory risk or poor ad efficiency
- Finally, confirm the points that require human judgment
I felt that this order was very practical.
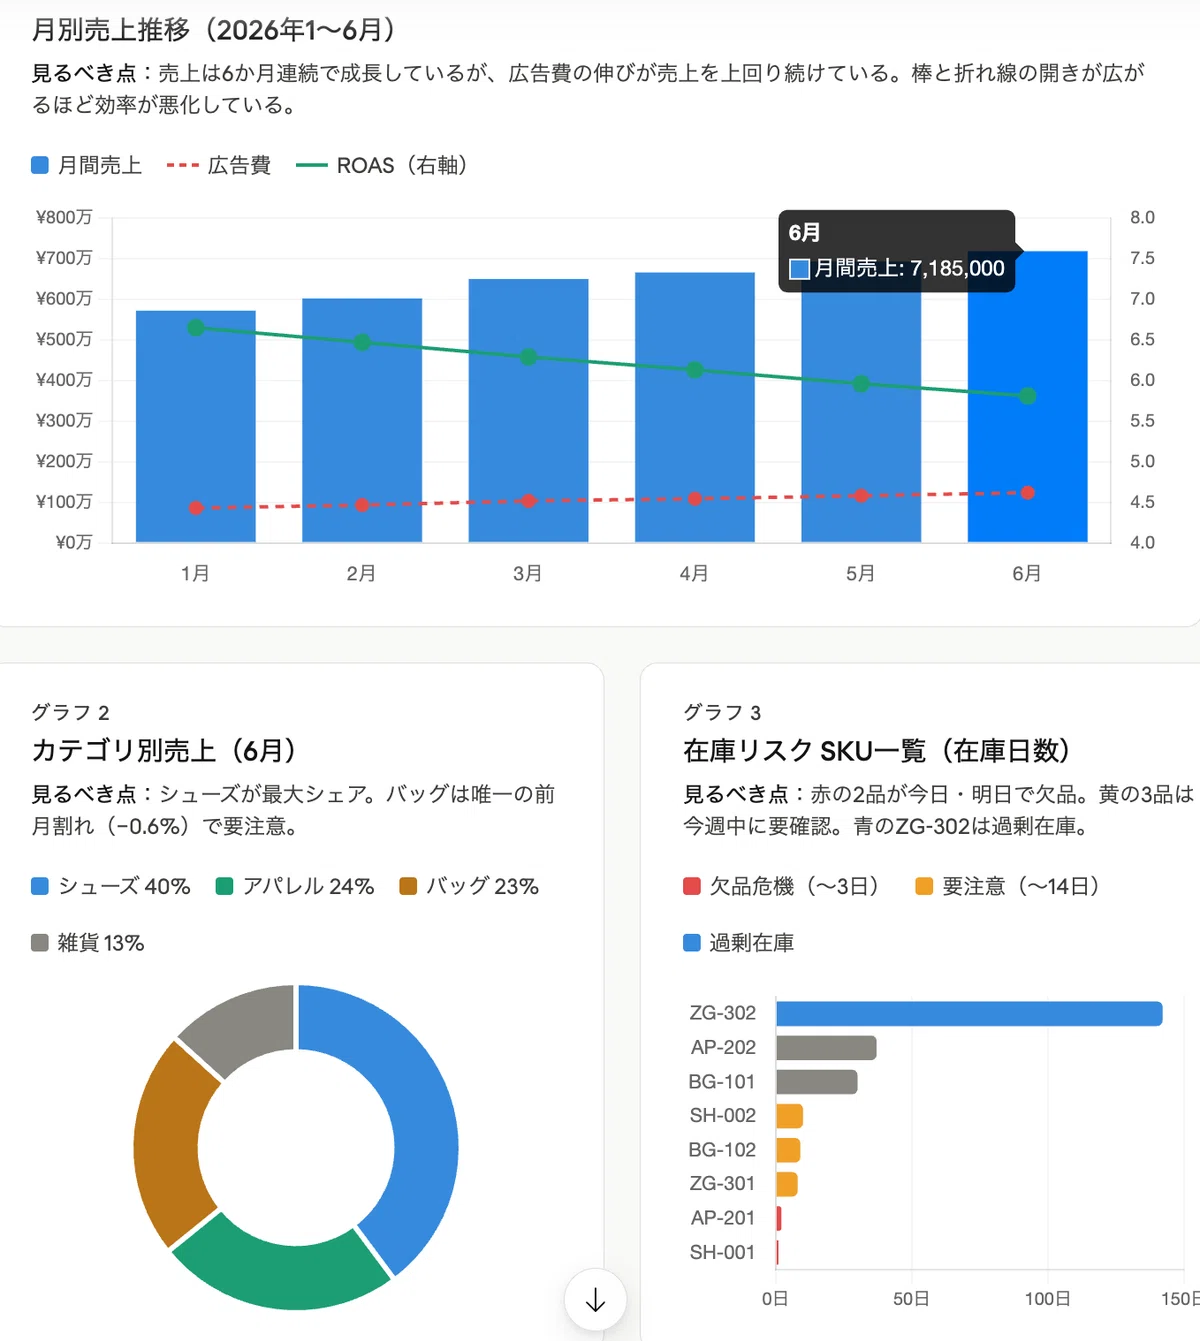
Having charts makes it much easier to decide which numbers to look at first.
When teams want to shorten pre-meeting alignment, this can be surprisingly helpful.
Summary
After trying Claude this time, I felt quite positive about its potential.
What stood out to me was not that Claude can produce an impressive analysis in one shot.
Rather, it was the way Claude supports the small tasks that happen repeatedly in e-commerce operations.
- Opening a spreadsheet
- Looking at the numbers
- Finding SKUs that need attention
Each task is small, but when repeated every week, the workload becomes heavier than expected.
Even reducing part of that burden can be a real help for teams on the ground.
In future e-commerce operations, I expect AI to be used less as something that does everything automatically, and more as something that reads the numbers first, finds notable changes, and organizes them into a form that people can judge more easily.
Instead of spending time searching for numbers, operators may be able to spend more time deciding which products to prioritize, which measures to review, and where human judgment is needed.
This Claude update made that shift feel much more realistic.
References
- Official: Use Claude for Excel / Claude Help Center / https://support.claude.com/en/articles/12650343-use-claude-for-excel
- Official: Create and edit files with Claude / Claude Help Center / https://support.claude.com/en/articles/12111783-create-and-edit-files-with-claude
- Official: Claude builds interactive visuals right in your conversation / Claude / https://claude.com/blog/claude-builds-visuals
- Analysis: Anthropic’s Claude AI can respond with charts, diagrams, and other visuals now / The Verge / https://www.theverge.com/ai-artificial-intelligence/893625/anthropic-claude-ai-charts-diagrams
For more information about GDX Inc., please visit the following link.
Company website: https://gdx.inc/
※Part of this article was created with support from ChatGPT and then edited and revised by the author. The content reflects the author’s personal views and does not represent an official statement or position of GDX Inc. The information is provided for reference purposes only. Please check official announcements and primary sources for the latest details.