【AI INSIGHTS】From Whiteboards to Sheets: Rethinking E-Commerce Planning with Claude

Hello, I’m Mia Sato, an AI Researcher at GDX.
A while ago, I came across a post from a Shopify merchant that stuck with me. One of their popular products had sold out, but ads were still sending customers to the product page for several days. People were clicking because the ad had caught their interest, only to arrive at a sold-out page.
It is frustrating for the customer, but it is also a problem for the team running the store.
Advertising, inventory, and fulfillment are all connected. But when one of the numbers changes halfway through a campaign, where should the team start checking, and what else needs to be reconsidered?
Around the same time, Claude introduced two new beta features called Whiteboards and Sheets. Both were announced in November 2026, so I decided to use them with a fictional e-commerce campaign and see what would happen when one of the original assumptions — inventory — changed.
Start by separating what we know from what we still need to check
I created a simple scenario: a small online store selling household goods is preparing for a year-end campaign.
The campaign begins in seven days. The target is 150 orders. The store has 120 units of its main product available for sale, and replenishment would take three weeks. None of these figures come from a real store.
The advertising team wants to feature the main product prominently. The merchandising team is worried about running out of stock. Logistics is concerned about a sudden spike in shipments, while customer support expects more inquiries.
I started with Claude Whiteboards. I pasted the campaign conditions into Ask Claude and asked it to separate the discussion into three groups: confirmed information, proposals, and items that still needed to be checked. I also asked it not to force different opinions into a single conclusion.
The result was a board filled with color-coded cards, with arrows showing how the different teams and concerns were connected.
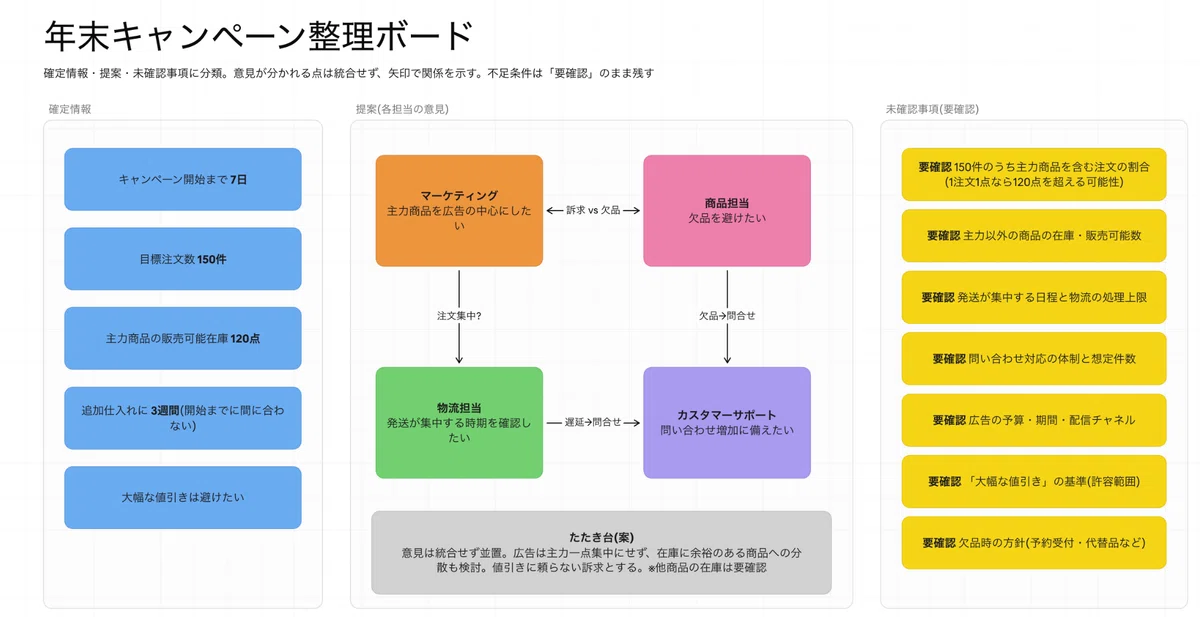
Image 1: The initial Whiteboard, showing confirmed information, proposals, and items that still need to be checked.
But the part that caught my attention was the yellow card on the right: how many of the 150 orders would actually include the main product?
A target of 150 orders does not mean 150 units of the main product will be sold. So even though inventory is only 120 units, it would be too early to conclude that the campaign is automatically 30 units short.
What I liked was that Claude did not quietly invent the missing number. It left the uncertainty visible as something that still needed to be checked.
I had expected the Whiteboard to make the opinions easier to read. Instead, the most useful part was seeing what we still did not know.
Use Sheets to test the number we do not know yet
That led to the next question: at what point would demand for the main product exceed the available inventory?
In the same Claude conversation, I asked it to keep the original Whiteboard and create a separate Sheet for checking inventory. Claude created a new spreadsheet and linked it back to the Whiteboard, so the work still felt connected to the original discussion.
There was still one problem: I did not have real sales data. So for this test, I assumed that 70% of the 150 orders would include the main product, with a maximum of one unit per order.
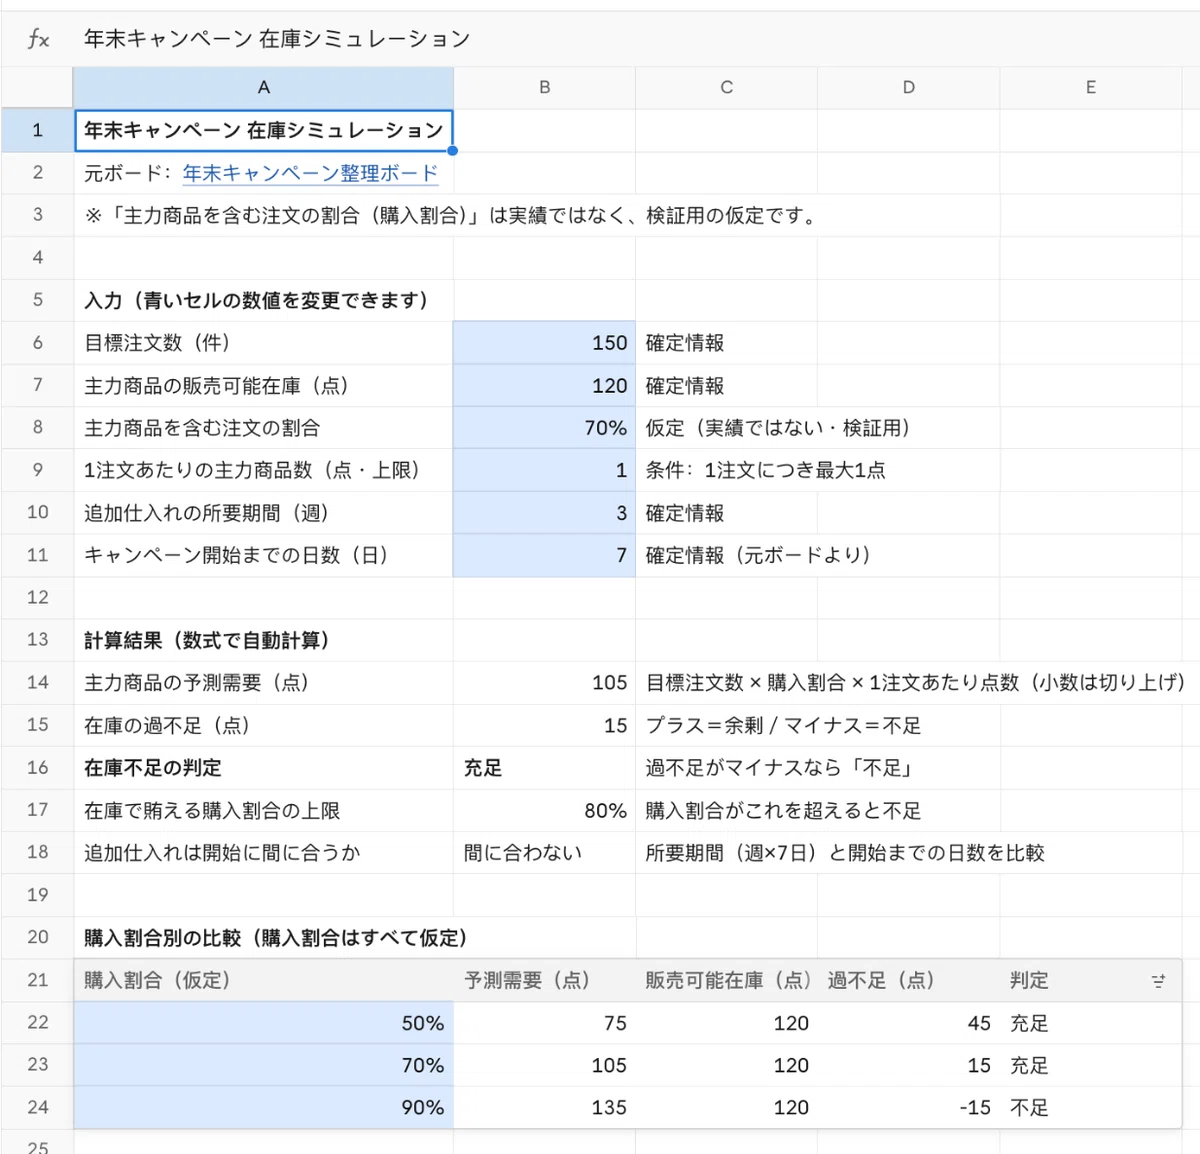
Image 2: A Sheet created from the Whiteboard to compare inventory under different assumptions.
At 70%, the expected demand for the main product is 105 units, leaving 15 units in stock. At 50%, 45 units remain. At 90%, the store would be 15 units short. The Sheet also showed that the current inventory of 120 units could support up to 80% of the 150 orders containing the main product.
The vague concern from the Whiteboard — “we might run out of stock” — had become a much more specific question in Sheets: what percentage of orders will include the main product?
Still, 70% was only a number I entered for the experiment. I appreciated that it was clearly treated as a test assumption. A correct calculation does not make the assumption itself true.
Dropping inventory from 120 to 90 raised a different set of questions
Next, I edited the inventory cell directly and changed the available stock from 120 units to 90. I did not ask Claude another question; I simply changed the value in the Sheet.
The expected demand of 105 units stayed the same, but the inventory balance changed from 15 units remaining to a 15-unit shortage. The status also changed from sufficient to insufficient. Under the 90% scenario, the shortage grew to 45 units.
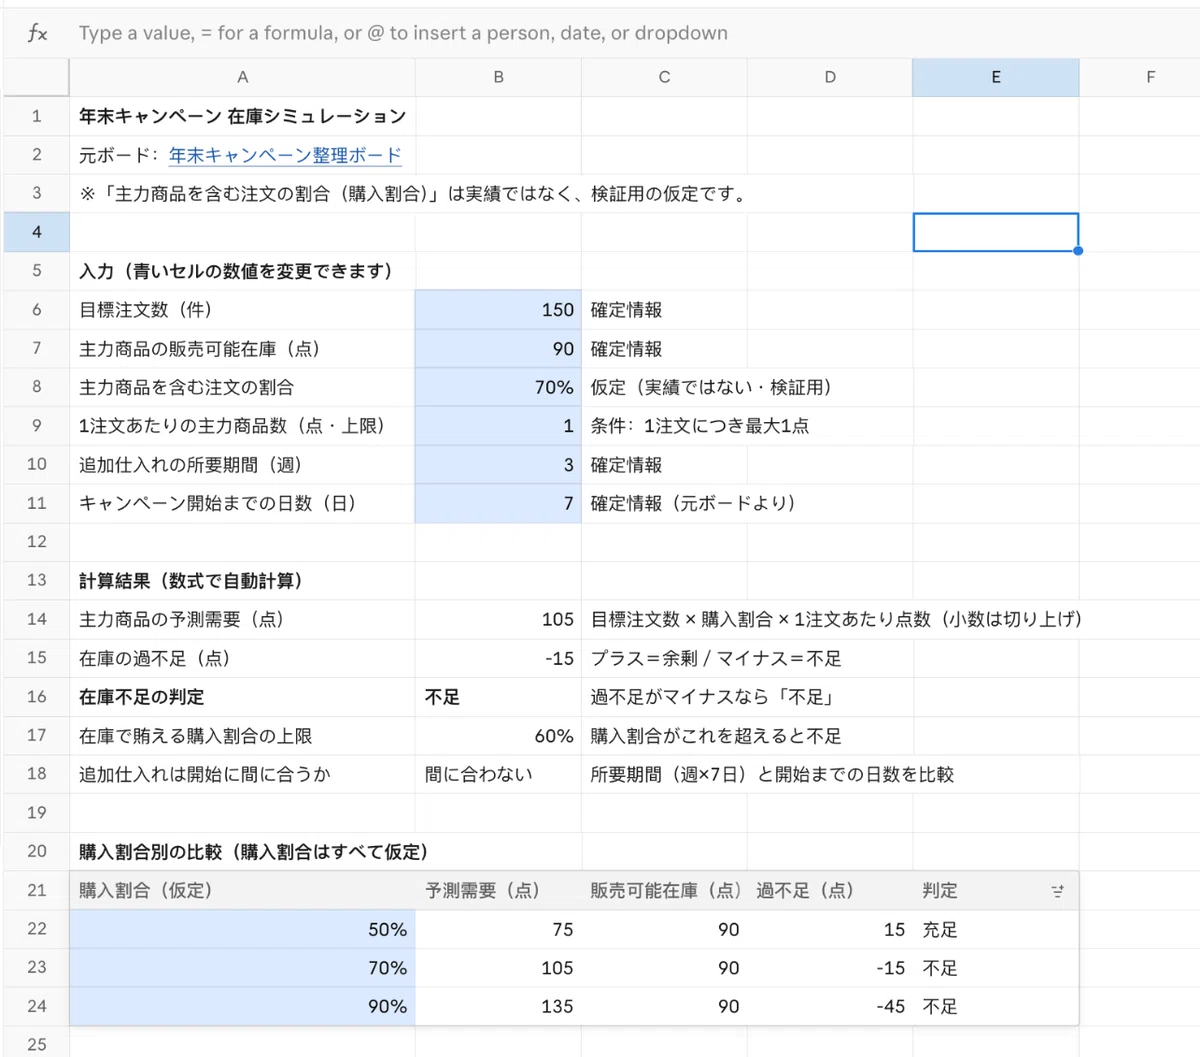
Image 3: After available inventory was reduced from 120 to 90 units, the result changed from sufficient to insufficient.
The first question that came to mind was no longer about inventory. It was: should we really keep the advertising plan as it is?
The shortage only exists under the 70% assumption, but it still made me want to consider featuring other products. Replenishment would not arrive before the campaign begins, so I also started thinking about what customers should see if the main product sells out.
I had only reduced the inventory number by 30 units, yet the discussion in my head had already expanded from stock levels to advertising and customer communication.
That made me want to go back to the original Whiteboard.
Returning to the Whiteboard changed the conversation
I told Claude what I had learned in Sheets and asked it to update the earlier Whiteboard. I also repeated two important points: the 70% figure was only an assumption, and we were not making a final campaign decision yet.
The updated Whiteboard kept the original structure, but the inventory figure changed from 120 to 90 units. More importantly, Claude added a new section for reviewing the campaign after the inventory update.
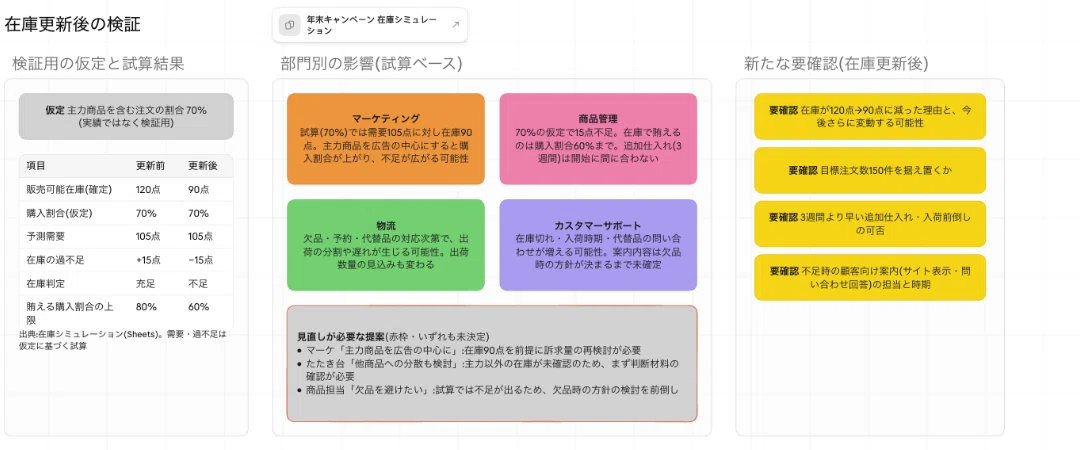
Image 4: The lower section of the updated Whiteboard, with new questions and impacts for each team.
Should advertising still center on the main product? Can merchandising shift attention toward alternatives? What should logistics and customer support do if the product sells out?
The opinions that had originally just been placed next to each other on the Whiteboard had now turned into a more practical question: who needs to check what next?
The four teams were ones I had defined at the start. Claude did not independently discover every stakeholder. But the inventory change helped reorganize the original discussion around the parts of the plan that now needed to be reviewed.
Testing the workflow also revealed two limitations.
First, changing a number in Sheets did not automatically update the Whiteboard. I had to tell Claude what had changed. Second, as the Whiteboard grew, some of the text became too small to read comfortably. In a meeting, it would probably be better to show only the section currently being discussed.
The real value may be remembering what has not been checked yet
The thing I remember most from this experiment is surprisingly simple: the unanswered question on the first Whiteboard.
“What percentage of orders will include the main product?”
That one open question led me into Sheets, where I tested the numbers. Then I changed the inventory. That change raised new questions about advertising and customer communication, which sent me back to the Whiteboard again.
If I had simply asked Claude at the beginning to create the best possible campaign plan, I might have received a polished proposal and been satisfied with it.
But e-commerce operations do not stay still. Inventory changes. Delivery schedules move. A plan that made sense when it was created may not still make sense a few days later.
Whiteboards and Sheets did not automatically manage all of those changes for me. What they did support was a useful loop: capture the unanswered question, test it with numbers, and then bring the result back into the broader discussion.
Next time, I would like to replace the 70% assumption with real order data.
What I found most interesting this time was not that AI finished the campaign plan for me. It was that the tools helped me keep track of what still needed to be verified before treating the plan as finished.
References
- Anthropic, “Introducing Claude Whiteboards, Claude Sheets, and Claude Data” — November 10, 2026
https://claude.com/resources/articles/sheets-whiteboards-data - Anthropic Help Center, “Get started with Claude Whiteboards”
https://support.claude.com/en/articles/18324319-get-started-with-claude-whiteboards - Anthropic Help Center, “Get started with Claude Sheets”
https://support.claude.com/en/articles/18324300-get-started-with-claude-sheets - Reddit, “Found out today I've been paying for clicks to a sold out page” — Shopify merchant post, July 2026
https://www.reddit.com/r/shopify/comments/1uw5q53/
Parts of this article were created with the support of ChatGPT and then reviewed and edited by the author. The views expressed are the author’s own and do not represent an official statement or position of GDX Inc. This article is provided for reference purposes; please consult the original official sources for the latest information.